In today’s digital landscape, understanding user behavior on your website is essential for driving conversions and business success. By effectively using web analytics tools, businesses can turn raw data into actionable insights, leading to improved user experience and higher conversion rates. This article explores how businesses can leverage tools like Google Analytics, heat maps, and A/B testing to optimize their websites, with insights from GreenHaven Interactive, a leader in digital marketing solutions.
Contents
Understanding Web Analytics
Web analytics involves collecting, measuring, and analyzing website data to improve performance. Key metrics include:
- Page Views: The total number of pages viewed.
- Sessions: A group of user interactions within a given timeframe.
- Bounce Rate: The percentage of single-page sessions where users left without interacting further.
- Conversion Rate: The percentage of users who complete a desired action, such as making a purchase or signing up for a newsletter.
Tracking website metrics is essential for businesses to identify potential weaknesses and opportunities. For example, if the bounce rate is high on a landing page, it could indicate content irrelevance, slow loading speeds, or poor design—all factors that can be improved with data-driven insights.
Utilizing Google Analytics
Google Analytics is a powerful tool that provides in-depth insights into website performance. Businesses can use it to track key metrics, understand user demographics, and monitor traffic sources. Some of the most valuable features include:
- Real-Time Data: Monitor live user activity.
- Audience Insights: Gain information on user demographics and behaviors.
- Acquisition Reports: Understand how users find your website.
- Behavior Flow: Identify popular pages and potential drop-off points.
By analyzing these metrics, businesses can make data-backed improvements. For instance, if a company sees a low conversion rate despite high traffic, they may need to revisit website optimization strategies such as improving page speed, mobile responsiveness, and content relevance.

Implementing Heat Maps for Better Engagement
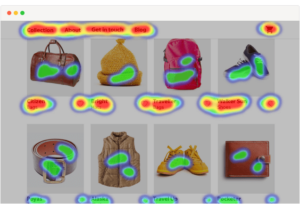
Heat maps, such as those provided by tools such as Microsoft Clarity, visually represent user interactions on a webpage, showing where visitors click, scroll, or hover. Popular types of heat maps include:
- Click Maps: Highlight frequently clicked areas.
- Scroll Maps: Show how far users scroll down a page.
- Hover Maps: Indicate where users hover their cursors.
Using heat maps, businesses can make strategic adjustments, such as repositioning calls-to-action (CTAs) in areas where users engage most. If a scroll map reveals that visitors rarely reach the bottom of a page, important content should be moved higher. For a real-world example, companies that analyze heat maps often refine their website design to improve user experience and conversion rates.
Conducting A/B Testing to Drive Results
A/B testing, or split testing, involves comparing two webpage versions to determine which performs better. Businesses often test elements like:
- Headlines: Different wording or styles to capture attention.
- Images: Variations in visuals to determine impact on engagement.
- CTAs: Different phrases, colors, or placements to see what drives more conversions.
- Layouts: Alternative content arrangements to improve user experience.
How to Run an A/B Test:
- Set a Goal: Define what you want to improve, such as click-through rates or sign-ups.
- Create Variations: Develop different versions of the element to test.
- Run the Test: Present the variations to similar audience segments.
- Analyze Results: Identify which version performed better using statistical analysis.
Regular A/B testing allows businesses to refine their websites continuously. For example, if a CTA button change results in a higher conversion rate, companies should implement that version sitewide. Combined with data from heat maps and analytics, A/B testing provides insights into user behavior that drive business growth.

The Role of GreenHaven Interactive
GreenHaven Interactive has over 20 years of experience in digital marketing, specializing in:
- Website Design: Crafting user-friendly, visually appealing sites.
- Search Engine Optimization (SEO): Improving website visibility on search engines.
- Social Media Marketing: Engaging audiences across various platforms.
- Content Writing: Developing compelling content that resonates with target audiences.
GreenHaven Interactive helps businesses understand user behavior, identify pain points, and implement data-driven solutions to drive conversions by leveraging SEO strategies and web analytics.
Integrating Web Analytics into Your Strategy
To improve conversions using web analytics, businesses should:
- Set Clear Objectives: Define what constitutes a conversion, such as purchases or sign-ups.
- Choose the Right Tools: Utilize Google Analytics and heat mapping tools.
- Monitor Regularly: Review analytics data to identify trends and areas needing improvement.
- Gather User Feedback: Gain qualitative insights into user experiences.
- Run A/B Testing: Experiment with changes and implement those that work.
- Partner with Experts: Collaborate with GreenHaven Interactive to leverage expertise and ensure best practices.
Web analytics is essential for businesses looking to increase conversions and compete in the digital marketplace. By leveraging tools like Google Analytics, heat maps, and A/B testing, businesses can create user-centric websites that attract and convert visitors. Partnering with experts like GreenHaven Interactive ensures businesses effectively implement these strategies for long-term success.


